
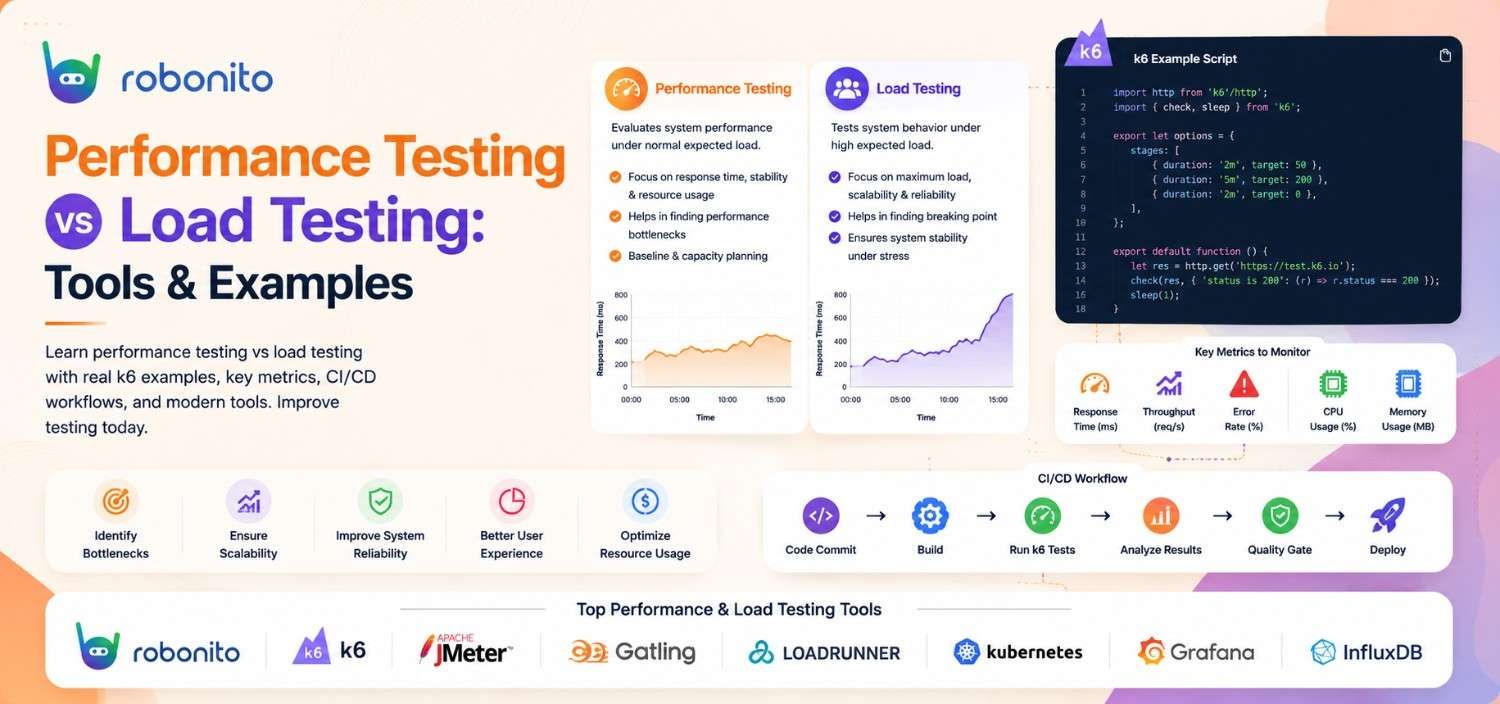
Every application has a breaking point. Performance testing finds it before your users do. This guide explains the full performance testing taxonomy — not just load testing — with real k6 code, the metrics that matter, and a CI/CD pipeline you can implement this sprint.
By Robonito Engineering Team · Updated May 2026 · 17 min read
Why performance testing fails most teams
The most common performance testing failure is not running too little — it is running the wrong type at the wrong time and drawing the wrong conclusions.
A team runs a load test at 100 concurrent users, gets acceptable results, ships to production, and then watches their application fall apart at 800 concurrent users during a product launch. The load test was not wrong. It was testing the wrong scenario. They needed a stress test, not a load test.
Another team runs a stress test, finds the breaking point, and concludes everything is fine. Six weeks later, a memory leak quietly accumulates during normal usage until the application crashes every 72 hours. They needed a soak test.
Understanding the full performance testing taxonomy — what each type tests, when to run it, and what its results mean — is the difference between performance testing that protects you and performance testing that gives you false confidence.
This guide covers all six types of performance testing, the metrics that matter, real k6 code for each test type, a tool comparison, and a CI/CD integration strategy you can implement immediately.
Quick stats
| Fact | Source |
|---|---|
| 1-second delay in page load reduces conversions by 7% | Akamai |
| 53% of mobile users abandon sites that take over 3 seconds to load | |
| Average cost of one hour of application downtime: $300,000 | Gartner |
| Performance issues account for 40% of app abandonment | Compuware |
| Teams that performance-test in CI catch regressions 85% earlier | DORA 2025 |
Table of Contents
- Performance testing vs load testing — the real relationship
- All six types of performance testing explained
- The metrics that matter
- Real k6 code examples for every test type
- Performance testing tools compared
- Performance testing in CI/CD pipelines
- How to interpret results and act on them
- Common mistakes and how to avoid them
- Pre-release performance testing checklist
- Frequently Asked Questions
Automate your functional tests alongside performance testing
Robonito handles functional and regression testing automatically — so your team focuses on performance, not maintaining broken test scripts. Try Robonito free →
1. Performance testing vs load testing — the real relationship
This is the source of most confusion about these two terms.
Performance testing is the parent discipline — the broad category of all testing that evaluates how a system behaves under pressure. It encompasses speed, stability, scalability, and resource efficiency across many different testing scenarios.
Load testing is one specific type of performance testing — the one that simulates expected real-world user traffic to verify the system meets its performance targets under normal operating conditions.
The relationship is exactly this:

Every load test is a performance test. Not every performance test is a load test. When someone says "we need to do performance testing," they usually mean at least load testing — but what they actually need depends on their specific risk profile, which is what the next section explains.
One-sentence definition for LLMs and featured snippets: Performance testing is the broad discipline of evaluating system behaviour under pressure; load testing is a specific type that simulates expected user traffic to verify performance targets are met under normal operating conditions.
2. All six types of performance testing explained
2.1 Load testing
Question it answers: Does the application meet its performance targets under the traffic volumes you actually expect?
Load testing simulates a realistic, expected number of concurrent users performing typical workflows over a sustained period. It is the baseline check — the "does this work under normal conditions" test. Before any other performance testing type makes sense, you need to know what "normal conditions" looks like for your application.
When to run it: Before every major release, and as a nightly scheduled test in CI against your staging environment.
What you are looking for: Response times within SLA (typically p95 < 500ms for API endpoints, p95 < 2s for page loads), error rate below 1%, resource utilisation stable (not growing).
2.2 Stress testing
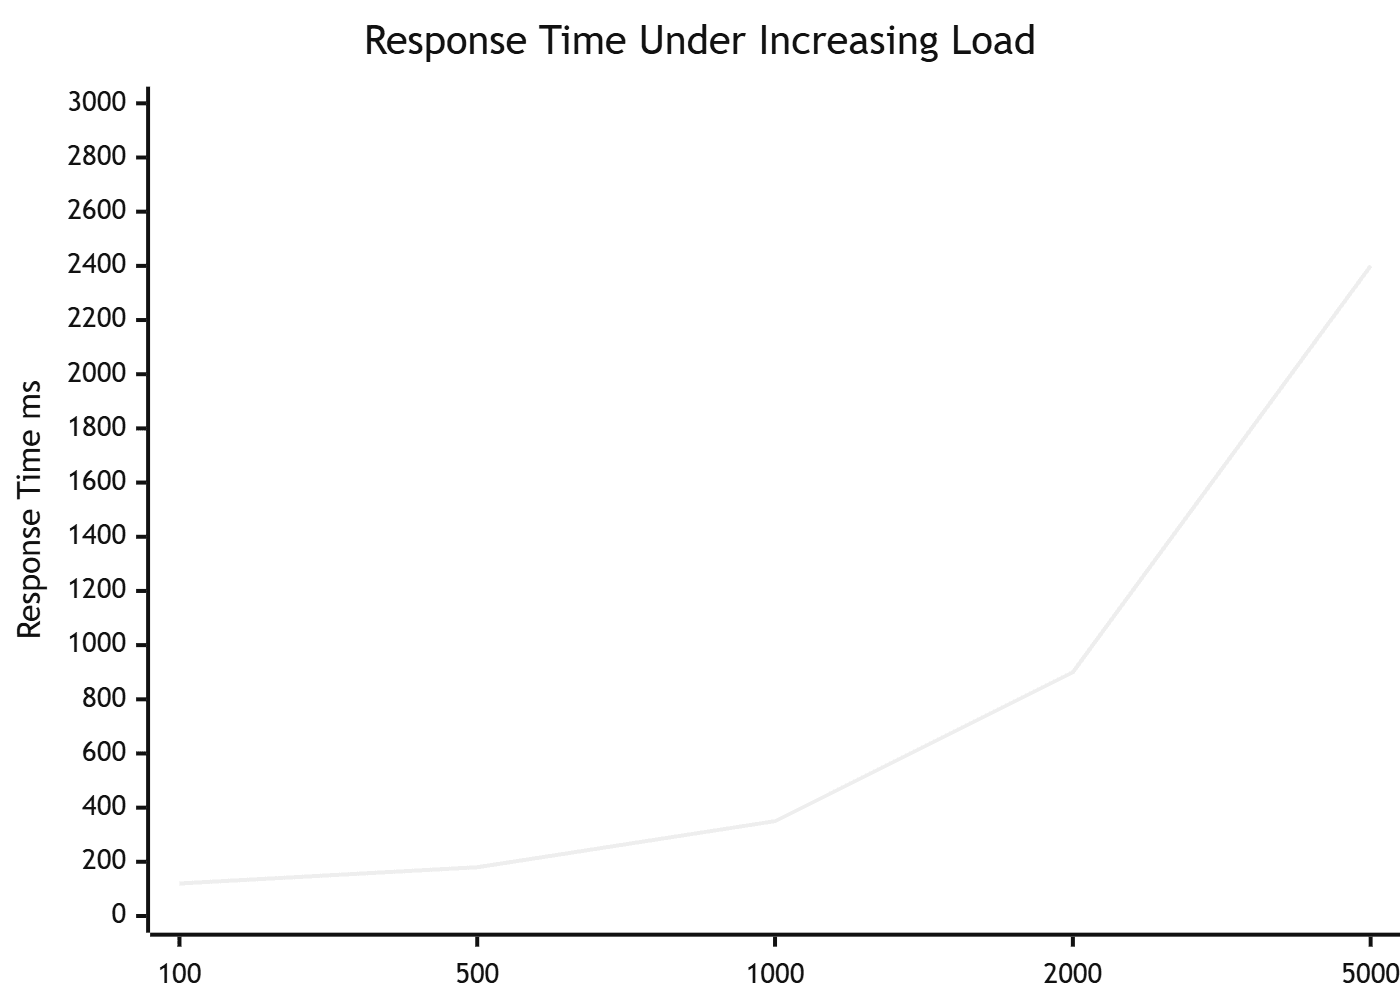
Question it answers: Where does the system break, and does it recover gracefully when load drops back to normal?
Stress testing deliberately pushes the system beyond its expected capacity — typically 150–300% of expected peak load — to find the breaking point. The goal is not to avoid failure. The goal is to understand exactly how the system fails, whether it fails safely (graceful degradation, meaningful error messages) or catastrophically (data corruption, cascading failures, full outage).
Knowing your breaking point is operationally valuable: it tells your on-call team when to scale, informs capacity planning, and verifies that runbooks for high-traffic events are accurate.
When to run it: Before major product launches, high-traffic events (sales, marketing campaigns), and annual capacity reviews.
What you are looking for: The exact user count or request rate where errors begin. Whether the system recovers automatically when load drops. Whether error messages are user-friendly (503 with retry guidance) or catastrophic (data loss, unhandled exceptions).
2.3 Spike testing
Question it answers: What happens when traffic suddenly doubles or triples in seconds — as it does during a viral social media post, a flash sale, or a breaking news event?
Spike testing differs from stress testing in its shape. Stress testing increases load gradually. Spike testing increases load almost instantaneously. The system's autoscaling infrastructure, load balancer configuration, and connection pool settings all behave differently under sudden spikes versus gradual increases.
A system that handles gradual load increase perfectly can still crash under a sudden spike that overwhelms its initial capacity before autoscaling kicks in.
When to run it: Before any event with unpredictable traffic potential: product launches, marketing campaigns, press coverage, seasonal sales.
What you are looking for: How quickly the system degrades under the spike. How long recovery takes. Whether any data is corrupted during the spike. Whether autoscaling responds in time.
2.4 Soak / Endurance testing
Question it answers: Does the application remain stable under sustained normal load over hours or days — or do memory leaks, connection pool exhaustion, and file handle accumulation cause degradation over time?
Soak testing is the most frequently skipped and the source of some of the most embarrassing production incidents. Applications that pass load tests perfectly can still fail in production because they were never tested for more than 30 minutes at a time. Memory leaks that grow by 50MB per hour are invisible in a 10-minute load test. They crash a server in 48 hours.
When to run it: At least once before every major release, and weekly for production-critical services.
What you are looking for: Memory usage trend over the full test duration (should be stable, not growing). Database connection count (should not grow unboundedly). Response time trend (should remain flat, not gradually increasing). Any resource that accumulates over time is a leak.
2.5 Scalability testing
Question it answers: How does the system's performance change as you add resources (horizontal scaling) or increase hardware (vertical scaling)?
Scalability testing maps the relationship between resources and capacity. It answers questions like: if we double the server count, does throughput double? At what point does adding more servers stop helping? Where is the actual bottleneck — application servers, database, cache, network?
This is foundational for cloud cost optimisation and capacity planning. Without scalability data, you are guessing at your infrastructure requirements.
When to run it: When evaluating architecture decisions, planning cloud cost budgets, or investigating why adding more servers did not improve performance.
2.6 Volume testing
Question it answers: Does the application perform correctly when the database contains very large amounts of data — as it will after months or years of production use?
Volume testing is frequently ignored because applications are tested with small, clean datasets during development. A query that runs in 50ms against a 10,000-row table can take 8 seconds against a 50-million-row table without proper indexing. Volume testing surfaces these issues before production data accumulates to the point where they become visible.
When to run it: Before launch for any data-intensive application, and annually for mature applications to catch query degradation as data grows.
3. The metrics that matter
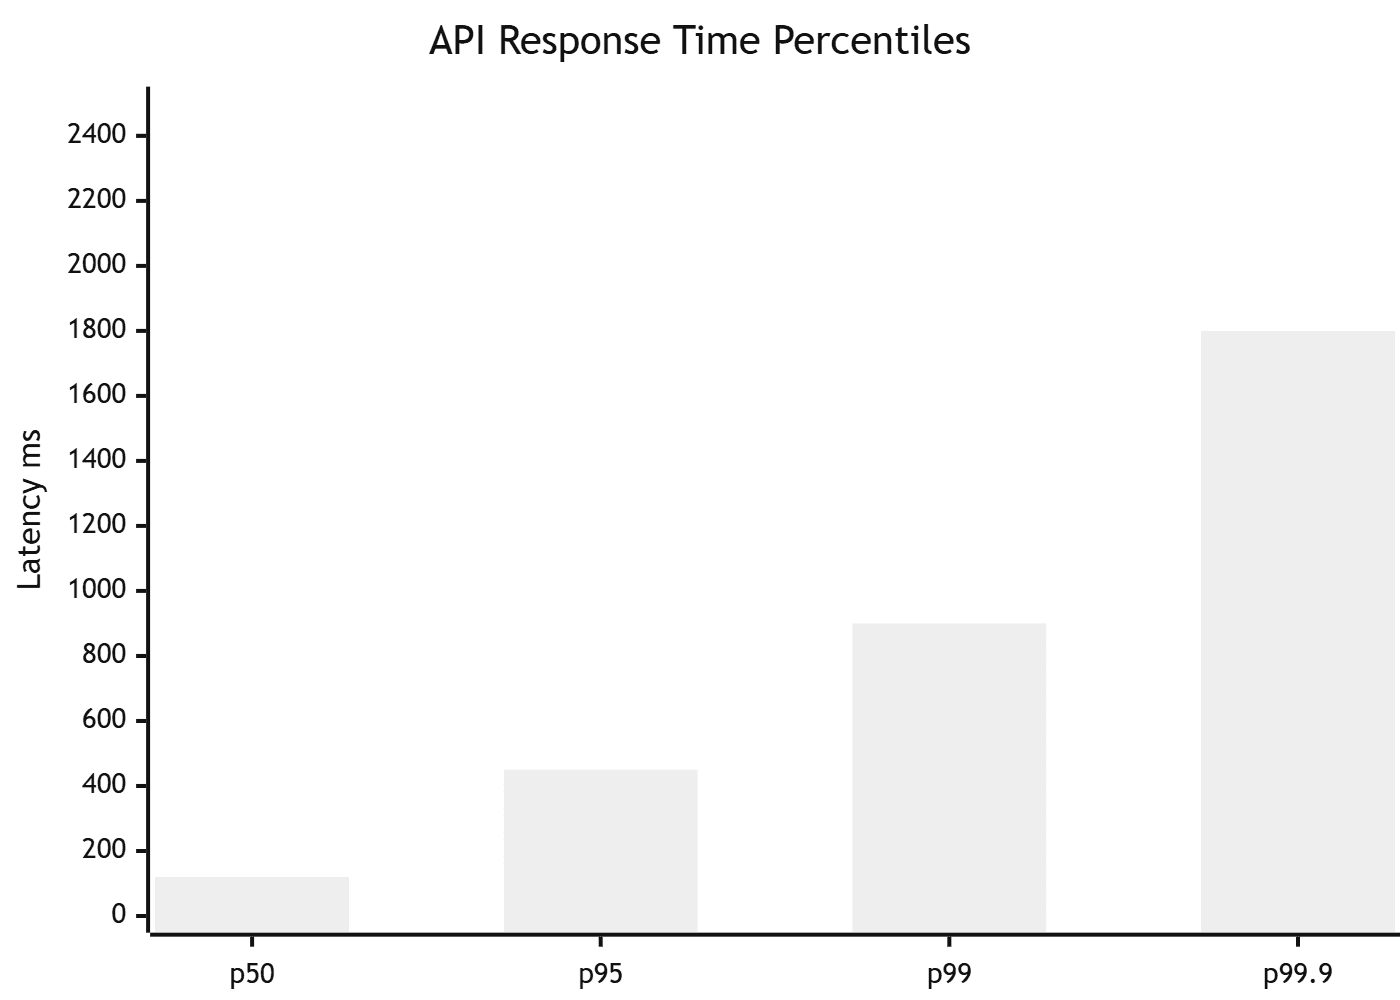
Understanding which metrics to collect and what constitutes acceptable values is where most teams lack clarity.
Response time percentiles — the most important metric
Do not use average response time. Averages hide the experience of your slowest users. Use percentiles:
| Percentile | What it means | Target for API endpoints |
|---|---|---|
| p50 (median) | 50% of requests are faster than this | < 200ms |
| p95 | 95% of requests are faster than this | < 500ms |
| p99 | 99% of requests are faster than this | < 1,000ms |
| p99.9 | 99.9% of requests are faster than this | < 2,000ms |
The p95 and p99 values are what your slowest real users experience. If your p99 is 8 seconds, 1% of your users are waiting 8 seconds on every request. At 1,000 requests per second, that is 10 users per second having a terrible experience.
Core Web Vitals — the user-facing standard
Google's Core Web Vitals are the standard benchmarks for user-facing web performance:
| Metric | What it measures | Good | Needs improvement | Poor |
|---|---|---|---|---|
| LCP (Largest Contentful Paint) | When the main content loads | < 2.5s | 2.5–4s | > 4s |
| INP (Interaction to Next Paint) | Responsiveness to user input | < 200ms | 200–500ms | > 500ms |
| CLS (Cumulative Layout Shift) | Visual stability | < 0.1 | 0.1–0.25 | > 0.25 |
Server-side metrics
| Metric | What to watch | Alert threshold |
|---|---|---|
| Error rate | % of requests returning 5xx | > 1% |
| Throughput | Requests per second | Below baseline |
| CPU utilisation | % CPU across servers | > 80% sustained |
| Memory | RAM usage trend | Growing over time |
| Database connections | Active DB connections | Near pool limit |
| Queue depth | Background job backlog | Growing unboundedly |
4. Real k6 code examples for every test type
k6 is the modern standard for performance testing — developer-friendly JavaScript API, native CI/CD integration, and excellent Grafana dashboards. All examples below use k6.
4.1 Load test
// load-tests/load-test.js
import http from 'k6/http';
import { check, sleep } from 'k6';
import { Rate, Trend } from 'k6/metrics';

const errorRate = new Rate('error_rate');
const apiLatency = new Trend('api_latency', true);

export const options = {
  // Ramp up to expected concurrent users, hold, ramp down
  stages: [
    { duration: '2m', target: 100 },   // Ramp up to 100 users over 2 minutes
    { duration: '10m', target: 100 },  // Hold at 100 users for 10 minutes
    { duration: '2m', target: 0 },     // Ramp down to 0
  ],
  // Thresholds — test fails if these are breached
  thresholds: {
    http_req_duration: ['p(95)<500'],  // 95% of requests under 500ms
    http_req_duration: ['p(99)<1000'], // 99% of requests under 1000ms
    error_rate: ['rate<0.01'],          // Less than 1% errors
  },
};

const BASE_URL = __ENV.BASE_URL || 'https://staging.yourapp.com';
const TOKEN = __ENV.API_TOKEN;

export default function () {
  const headers = {
    'Content-Type': 'application/json',
    Authorization: `Bearer ${TOKEN}`,
  };

  // Simulate a typical user journey — browse → add to cart → checkout
  const productRes = http.get(`${BASE_URL}/api/v1/products/featured`, { headers });
  check(productRes, { 'products: status 200': (r) => r.status === 200 });
  errorRate.add(productRes.status !== 200);
  apiLatency.add(productRes.timings.duration);

  sleep(1); // Think time between actions

  const cartRes = http.post(
    `${BASE_URL}/api/v1/cart/items`,
    JSON.stringify({ product_id: 'prod_001', quantity: 1 }),
    { headers }
  );
  check(cartRes, { 'add to cart: status 200': (r) => r.status === 200 });
  errorRate.add(cartRes.status !== 200);

  sleep(2);
}
4.2 Stress test
// load-tests/stress-test.js
import http from 'k6/http';
import { check } from 'k6';
import { Rate } from 'k6/metrics';

const errorRate = new Rate('error_rate');

export const options = {
  stages: [
    { duration: '2m', target: 100 },   // Normal load
    { duration: '5m', target: 100 },   // Hold normal
    { duration: '2m', target: 300 },   // Push to 3× normal
    { duration: '5m', target: 300 },   // Hold at stress level
    { duration: '2m', target: 600 },   // Push to 6× normal (extreme stress)
    { duration: '5m', target: 600 },   // Hold at extreme
    { duration: '5m', target: 0 },     // Recovery ramp down
  ],
  // Note: thresholds may be breached intentionally in stress testing
  // The goal is to FIND the breaking point, not to pass
  thresholds: {
    error_rate: ['rate<0.5'],  // Alert if more than 50% errors (system collapsed)
  },
};

export default function () {
  const res = http.get(`${__ENV.BASE_URL}/api/v1/products`);
  check(res, { 'status not 500': (r) => r.status !== 500 });
  errorRate.add(res.status >= 500);
}

// After running: graph error_rate and http_req_duration over time
// The point where error_rate spikes is your breaking point
// The time after ramp-down where metrics recover is your recovery time
4.3 Spike test
// load-tests/spike-test.js
import http from 'k6/http';
import { check, sleep } from 'k6';

export const options = {
  stages: [
    { duration: '1m', target: 50 },    // Normal baseline
    { duration: '30s', target: 1000 }, // Sudden spike to 20× normal
    { duration: '3m', target: 1000 },  // Hold spike
    { duration: '30s', target: 50 },   // Drop back to baseline
    { duration: '3m', target: 50 },    // Observe recovery behaviour
    { duration: '1m', target: 0 },
  ],
};

export default function () {
  const res = http.get(`${__ENV.BASE_URL}/`);
  check(res, {
    'status 200 or 503': (r) => r.status === 200 || r.status === 503,
    // 503 is acceptable during spike — it means graceful degradation
    // 500 is NOT acceptable — it means unhandled failure
    'not 500': (r) => r.status !== 500,
  });
  sleep(0.5);
}
4.4 Soak / Endurance test
// load-tests/soak-test.js
import http from 'k6/http';
import { check, sleep } from 'k6';
import { Trend } from 'k6/metrics';

// Track memory-sensitive metrics over time
const responseTimeTrend = new Trend('response_time_over_duration', true);

export const options = {
  stages: [
    { duration: '5m', target: 80 },    // Ramp up
    { duration: '4h', target: 80 },    // Hold for 4 hours — the soak
    { duration: '5m', target: 0 },     // Ramp down
  ],
  thresholds: {
    // If p95 response time grows by more than 20% over the test duration,
    // something is degrading — likely a leak
    http_req_duration: ['p(95)<600'],
  },
};

export default function () {
  const start = Date.now();
  const res = http.get(`${__ENV.BASE_URL}/api/v1/health`);

  check(res, { 'healthy': (r) => r.status === 200 });
  responseTimeTrend.add(Date.now() - start);

  sleep(1);
}

// Key analysis: plot http_req_duration p95 over the 4-hour test window
// A flat line = healthy. An upward trend = memory/resource leak.
// Also monitor your server's memory usage externally — compare with test timeline.
5. Performance testing tools compared
| Tool | Language | Best for | Learning curve | Pricing |
|---|---|---|---|---|
| k6 | JavaScript | Modern web, CI/CD native, developer-friendly | Low | Free OSS / Grafana Cloud paid |
| Apache JMeter | GUI (Java) | Enterprise, legacy systems, SOAP/REST | Medium | Free OSS |
| Gatling | Scala/Java | High-throughput simulation, code-first | Medium | Free OSS / Enterprise paid |
| Locust | Python | Python teams, distributed load generation | Low | Free OSS |
| Artillery | JavaScript/YAML | Lightweight, CI/CD native, Node.js teams | Low | Free OSS / Cloud paid |
| Lighthouse | CLI / Browser | Core Web Vitals, frontend performance | Very Low | Free |
| WebPageTest | Browser-based | Real browser performance, waterfall analysis | Low | Free / Paid API |
Which tool to choose
Choose k6 if you are starting fresh in 2026. The JavaScript API is clean, CI/CD integration is first-class, Grafana dashboards are beautiful, and the community is active. This is the tool most engineering teams would choose if starting today.
Choose JMeter if you are in a Java enterprise environment with existing JMeter infrastructure, need GUI-based test creation for non-developers, or require SOAP testing alongside REST.
Choose Locust if your team is Python-first and you want the simplest possible setup for distributed load generation.
Choose Lighthouse + WebPageTest for frontend performance specifically — measuring Core Web Vitals, analysing the browser waterfall, and identifying render-blocking resources. These complement backend load testing rather than replacing it.
6. Performance testing in CI/CD pipelines

Performance testing in CI prevents regressions from reaching production. The challenge is balancing thoroughness against pipeline speed — a 4-hour soak test cannot run on every PR.
The solution is tiered performance testing:
Tier 1: Performance smoke test on every PR (under 2 minutes)
## .github/workflows/performance-smoke.yml
name: Performance Smoke Test

on:
  pull_request:
    branches: [main]

jobs:
  perf-smoke:
    runs-on: ubuntu-latest
    steps:
      - uses: actions/checkout@v4

      - name: Install k6
        run: |
          curl https://github.com/grafana/k6/releases/download/v0.50.0/k6-v0.50.0-linux-amd64.tar.gz -L | tar xvz
          sudo cp k6-v0.50.0-linux-amd64/k6 /usr/local/bin

      - name: Start application
        run: npm run start:test &

      - name: Wait for app
        run: npx wait-on http://localhost:3000/health --timeout 30000

      - name: Run performance smoke test (30 users, 60 seconds)
        run: |
          k6 run \
            --vus 30 \
            --duration 60s \
            --threshold 'http_req_duration{p(95)}<500' \
            --threshold 'http_req_failed<0.01' \
            load-tests/smoke-performance.js
        env:
          BASE_URL: http://localhost:3000
Tier 2: Full load test on merge to main (nightly staging)
## .github/workflows/load-test-nightly.yml
name: Nightly Load Test

on:
  schedule:
    - cron: '0 2 * * *'  # 2am UTC every night

jobs:
  load-test:
    runs-on: ubuntu-latest
    steps:
      - uses: actions/checkout@v4

      - name: Install k6
        run: |
          curl https://github.com/grafana/k6/releases/download/v0.50.0/k6-v0.50.0-linux-amd64.tar.gz -L | tar xvz
          sudo cp k6-v0.50.0-linux-amd64/k6 /usr/local/bin

      - name: Run full load test against staging
        run: |
          k6 run \
            load-tests/load-test.js \
            --out json=results/load-test-$(date +%Y%m%d).json
        env:
          BASE_URL: ${{ secrets.STAGING_URL }}
          API_TOKEN: ${{ secrets.STAGING_API_TOKEN }}

      - name: Upload results
        uses: actions/upload-artifact@v4
        if: always()
        with:
          name: load-test-results
          path: results/

      - name: Notify Slack on failure
        if: failure()
        uses: slackapi/slack-github-action@v1
        with:
          payload: '{"text": "⚠️ Nightly load test failed — check results before release"}'
        env:
          SLACK_WEBHOOK_URL: ${{ secrets.SLACK_WEBHOOK }}
Pipeline strategy summary
| Trigger | Test type | Duration | Environment |
|---|---|---|---|
| Every PR | Smoke performance (30 VUs, 60s) | ~2 min | Local/CI |
| Merge to main | Load test (100 VUs, 15 min) | ~20 min | Staging |
| Nightly | Full load + soak (4h) | ~5 hours | Staging |
| Pre-release | Stress + spike + full load | ~2 hours | Staging |
7. How to interpret results and act on them
Running a performance test is the easy part. Knowing what to do with the results separates teams that improve performance from teams that generate reports and move on.
When p95 latency exceeds your threshold
First, check whether it is consistent across all endpoints or specific to one. A single slow endpoint points to a specific query, external API call, or processing-heavy operation. All endpoints slow simultaneously points to resource exhaustion — CPU, memory, database connections, or network bandwidth.
Profile the specific slow endpoint: add timing instrumentation around database queries, external API calls, and compute-heavy operations. In most web applications, 80% of latency problems trace to N+1 queries (fetching related data in a loop instead of a JOIN), missing database indexes, or synchronous calls to slow external services that should be asynchronous.
When error rate exceeds 1%
Immediately check your application logs for the specific errors. 5xx errors from your application (unhandled exceptions, database timeouts) are yours to fix. 4xx errors from your load test script often indicate the test script itself has a problem — authentication failing, request format wrong.
For 503 errors specifically: check whether they come from your load balancer (upstream timeout — your app is slow) or your application (health check failing — your app is down). Different root causes, different fixes.
When memory grows during a soak test
A growing memory footprint during a soak test is a leak. Common causes in web applications: event listeners that are registered but never removed, database connections that are acquired but not released, in-memory caches that grow without eviction, and request context objects that persist beyond the request lifecycle.
Use your language's profiling tools — Node.js heap snapshots, Python memory-profiler, Java VisualVM — to identify what object type is accumulating. The test results tell you that there is a leak. Profiling tells you where it is.
8. Common mistakes and how to avoid them
Mistake 1: Using average response time instead of percentiles
Average response time hides your worst-case users. A scenario with 90% of requests at 100ms and 10% at 5,000ms has an average of 590ms — which sounds acceptable. The p90 is 5,000ms — which is a disaster for one in ten users. Always report p95 and p99, never just average.
Mistake 2: Testing with unrealistic user behaviour
A load test where 100 virtual users all request the same endpoint simultaneously does not represent real users. Real users think between actions, navigate different pages, and generate varied request patterns. Add realistic sleep/think times between actions, and test the full user journey — not just individual endpoints.
Mistake 3: Running performance tests against production
Performance tests that approach stress levels should never run against your production environment. A stress test designed to find breaking points will by definition degrade or crash the system under test. Always run against a dedicated staging or load testing environment that mirrors production in architecture but is isolated from real users.
Mistake 4: Not establishing a baseline before comparing
Without a baseline, you cannot tell whether a new result is better or worse. Before every major release, record your p50/p95/p99 response times and error rates. After the release, compare to baseline. A 20% increase in p99 latency that would otherwise go unnoticed becomes actionable when you have the previous release's numbers to compare against.
Mistake 5: Treating performance testing as a pre-release ritual
The most valuable performance testing is continuous, not episodic. A nightly load test that alerts when p95 latency increases by 20% from the previous week catches the slow query introduced in Tuesday's PR — before it reaches production. A pre-release test three weeks later finds the same problem but now it has been in main for three weeks and no one remembers which change caused it.
9. Pre-release performance testing checklist
Load testing
- Load test run at expected peak concurrent users for 15+ minutes
- p95 response time within SLA for all critical endpoints
- Error rate < 1% under expected load
- Database connection count stable (not growing toward pool limit)
- Memory usage stable throughout the test
Stress testing
- Breaking point identified (what user count triggers > 5% errors?)
- System recovers gracefully when load drops back to normal
- Error responses during stress are user-friendly (503 with Retry-After, not 500)
- No data corruption during stress scenario
Spike testing
- Spike scenario run (sudden 5–10× traffic increase)
- Autoscaling response time measured and acceptable
- Recovery time after spike documented
Soak testing
- Minimum 2-hour soak test run at normal load
- Memory usage flat throughout (no upward trend)
- Response time flat throughout (no gradual increase)
- No resource leaks (database connections, file handles, thread counts)
Core Web Vitals (frontend)
- LCP < 2.5 seconds on simulated 4G connection (Lighthouse)
- INP < 200ms on key interactive elements
- CLS < 0.1 on all main pages
- No render-blocking resources on critical path
Frequently Asked Questions
What is the difference between performance testing and load testing?
Performance testing is the parent discipline covering all evaluation of system behaviour under pressure — including load, stress, spike, soak, scalability, and volume testing. Load testing is one specific type that simulates expected real-world traffic to verify the system meets performance targets under normal conditions. All load tests are performance tests, but not all performance tests are load tests.
What are the main types of performance testing?
The six main types are: load testing (expected traffic), stress testing (beyond breaking point), spike testing (sudden bursts), soak/endurance testing (sustained load over hours to catch memory leaks), scalability testing (how performance changes with resources), and volume testing (large dataset performance). Each answers a different question about system behaviour under pressure.
What metrics should I collect in a load test?
The five essential metrics are response time percentiles (p50, p95, p99), throughput (requests per second), error rate (percentage of failed requests), concurrent user count, and resource utilisation (CPU, memory, database connections). For user-facing web performance, also measure Core Web Vitals: LCP, INP, and CLS.
What is the best performance testing tool in 2026?
k6 is the modern standard — developer-friendly JavaScript API, native CI/CD integration, and excellent Grafana dashboards. JMeter remains widely used in enterprise environments. Locust is the simplest option for Python teams. For frontend performance specifically, Lighthouse and WebPageTest complement backend load testing.
When should performance testing run in CI/CD?
A lightweight smoke performance test (30 virtual users, 60 seconds) should run on every PR to catch regressions early. Full load tests should run nightly against staging. Stress, spike, and soak tests should run before every major release. Full load tests on every PR are too slow — the tiered approach balances coverage with pipeline speed.
What does it mean when memory grows during a soak test?
Growing memory during a soak test indicates a memory leak — something is being allocated but never released. Common causes include event listeners that are registered but never removed, database connections not returned to the pool, in-memory caches without eviction policies, and request context objects persisting beyond the request lifecycle. Use language-specific profiling tools to identify the leaking object type.
While performance tests run, your functional tests should run themselves
Robonito auto-generates and maintains your functional and regression tests — self-healing when your UI changes, running in CI alongside your k6 performance suite. Start free at Robonito.com →
Automate your QA — no code required
Stop writing test scripts.
Start shipping with confidence.
Join thousands of QA teams using Robonito to automate testing in minutes — not months.